
Download Ken Fisher’s ‘I Hate Annuities’ Consumer Guide!
If you missed last week’s newsletter, to download Ken’s 14-page “Annuity Insights” consumer guide, click on the following:
https://advisorshare.com/kens-i-hate-annuity-guide
By this time of the year, most whole life carriers have declared their dividend for 2024. While the numbers are interesting, what I find more interesting is the raging debate of which cash value life policy makes more sense for clients….
Indexed Universal Life (IUL) vs. Whole Life (WL)
A few years ago I wrote a“client” newsletter comparing WL to IUL. I am giving permission for ANY advisor to use my article with clients.
To read that newsletter, click on the following: https://advisorshare.com/whole-life-vs-iul
2024 Declared WL Dividend Rates
Here are the 2024 declared rates of some popular carriers:
Mass Mutual 6.10%
New York Life 6.00%
Penn Mutual 5.75%
Guardian 5.90%
Northwestern Mutual 5.15%
Average historical dividends going back to 2012:
Mass Mutual 6.46%
New York Life 6.03%
Penn Mutual 6.08%
Guardian 5.86%
Northwestern Mutual 5.15%
What’s the IUL declared dividend = 0.00%? Hmm…a 0% declared rate isn’t good? But, of course, the design of IUL is to guarantee zero in down years and provide much more upside growth than WL.
The S&P 500 looks to be positive for the year and in a way that IUL will max out the returns based on the IUL cap (we’ll see, but the S&P 500 is up 11% so far and it’s an election year).
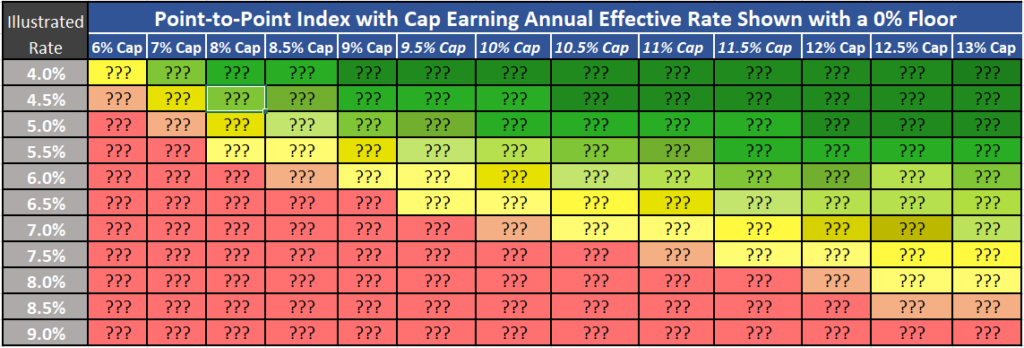
The following is a chart of the various allocation options:
Crediting Rate since 2012 for the “Best” IUL with the highest S&P 500-based cap
9.27%!
(Using today’s low current cap rates & published historical cap rates)
Hmm…IUL had much higher returns than the best WL policy. FYI, the company I used to calculate these numbers actually publishes the renewal history of its caps.
To learn more about the IUL with the highest S&P 500 caps, click on the following:
https://advisorshare.com/roccys-favorite-iul
2024 Updated IUL Rate of Return Probability Chart (a MUST-Download)!
To download the IUL ROR probability chart, click on the following link:
https://advisorshare.com/iul-probability-of-return
No offense, but most advisors (WL kool-aid drinking/IUL-hating advisors as well as those who like and recommend IUL) don’t know what a realistic long-term rate of return is in an IUL.
If you’d like to know the 25-year rolling average return for an IUL with various cap rates, you’ll want to download this probably of return chart.