

Before I get into the content of this week’s newsletter, if you missed last week’s newsletter…
Why Bonus FIAs to “Pay the Tax” on Roth Conversions are a Failure (White Paper)
To download my 14-page White Paper detailing specifically why using a 20% bonus FIA (Fixed Indexed Annuity) to “pay the tax” does NOT work, click on the following link:
https://advisorshare.com/bonus-fias-roth-failure
Bonus Webinar—August 13th at 3:00 p.m. EST
If you sign up for the download, you will also get access to attend a webinar where I will explain and show you with our OnPointe IRA Roth Conversion software why this concept doesn’t work!
The Stats are Crystal Clear
Here is a chart showing estimated average combined federal + state effective income tax rates by income percentile from 1950 to 2025:
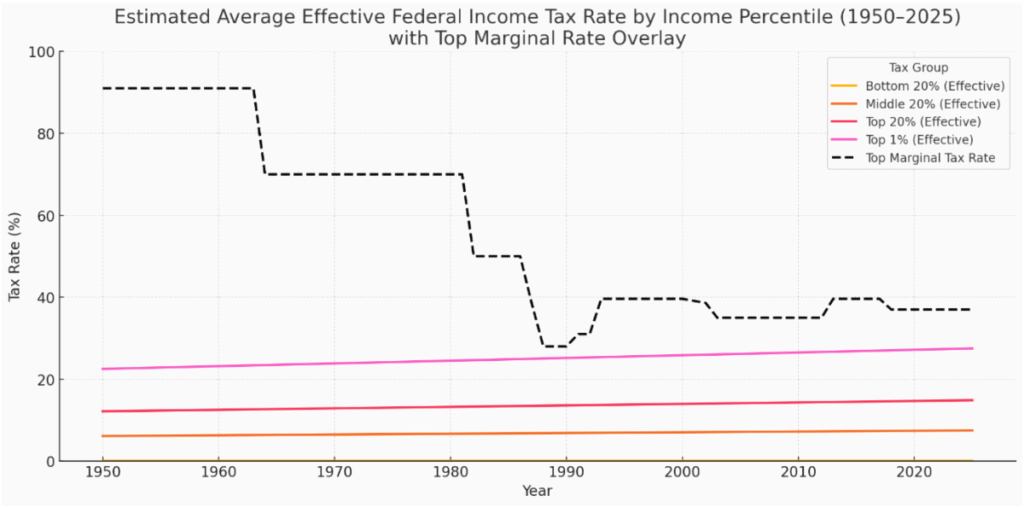
State tax estimates are based on national averages from Tax Foundation,
Institute on Taxation and Economic Policy, and Tax Policy Center studies.
-Bottom 20%: ~1–2%
–Middle 20%: ~9%
–Top 20%: ~18%
-Top 1%: ~31% (higher due to high state tax rates in progressive states)
I love this chart. It proves that the fearmongering over tax rates is total nonsense. Even when tax rates were high, due to all the deductions, the effective tax rate people paid was quite low.
What kind of clients do most advisors have? Most clients will be in the middle rate with an average effective rate of 9% and some will be in the top 20% and closer to 18% (rates that are quite low).
Why are effective tax rates a key when running Roth IRA conversion numbers?
MOST Roth IRA conversion calculators/apps DO NOT calculate the effective income tax rate of before or in retirement. This is a fatal flaw. If you are using software that only allows you to input what the client’s current/future effective rate is now and/or during/after conversion, you should IMMEDIATELY stop using it. The numbers will be so flawed it will blow your mind.
Example—Couple, both age 60, are working and earning $210,000 as their gross income.
Question: What do you think their current effective income tax rate is? 16.25%
Now assume the client retires at age 65 and has $750k in a tax-deferred IRA, $675k in a NO-qualified brokerage account, $70,000 of Social Security income, and has expenses of $155k.
To generate cash flow at age 65 to pay $155k in expenses, their projected effective rate is?
Only 1.13%!
Why so low? Their taxable SS income = $44,374 and the other money to pay bills came from spending down the NQ account (with zero capital gains tax due to client’s low taxable income).
What if the couple converted $25,000 of their $750,000 tax-deferred IRA every year for 25 years starting at age 60? How would that affect their effective income tax rates?
Effective income tax rate at age 60 = 16.69%
Effective income tax rate at age 65 (now retired) = 4.86%
Effective income tax rate after RMDs start = 13.73%
Guess how well a Roth IRA conversion worked for this client.
This client would run out of money, $73,000 early because of the conversion.
Why? There are a few reasons, but one of the TOP factors to determine if a Roth conversion will work is whether the client will be in a higher or lower effective tax rate in retirement.

Because the Roth conversion software advisors are currently using is FLAWED, we spent the last 12+ months creating the industry’s most and we believe only accurate Roth IRA conversion software.
Want to learn more about OnPointe’s Roth IRA conversion software? Just click on the following to watch a recorded demo.
https://onpointesoftware.com/roth-app-sign-up
Bonus Effective Tax Rate Chart—Pre- vs Post-Retirement
I had AI create a chart for middle to upper class clients (the clients advisors want more of). It further illustrates that most clients will NOT be in a higher income tax bracket in retirement.
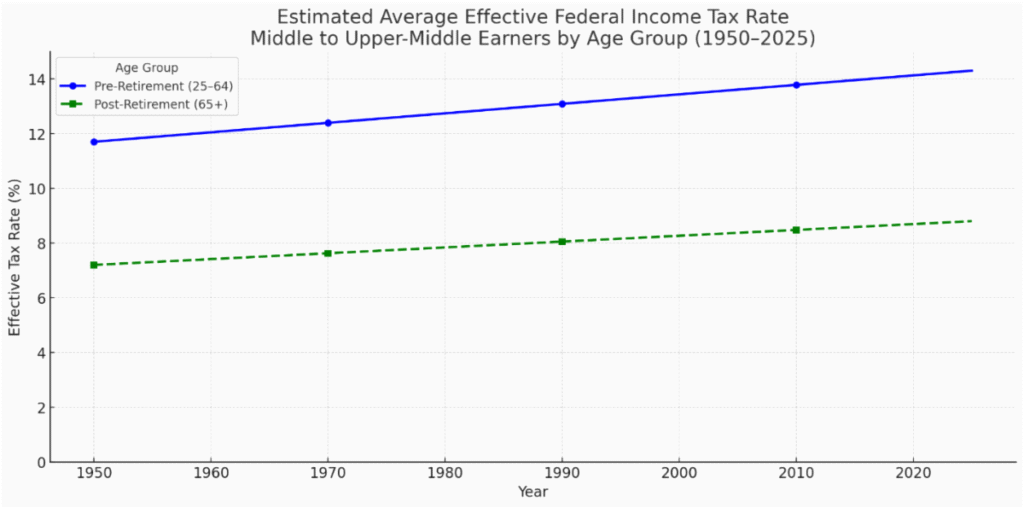
The estimates in the chart come from combining and interpolating several official sources: IRS Statistics of Income (SOI) Data Tables; Congressional Budget Office (CBO) Historical Effective Tax Rates; Tax Policy Center (TPC) Microsimulation Model Tables; Social Security Administration (SSA) Earnings Data; U.S. Census Bureau – Current Population Survey (CPS) & American Community Survey (ACS).