To download the UPDATED IUL ROR probability chart, click on the following link:
https://advisorshare.com/probability-of-return-2026
Need a Sales Mentor for AUM and FIAs?
Jonathan Camarda, CFA, CAIA, CMT, CIMA, to the Rescue!
Webinar—January 15th at 2:00 p.m. EST
If you missed last week’s newsletter about this webinar, click on the following to sign up:
https://advisorsharewm.com/jonathan-camarda-webinar
Who should download this probability chart?
-Advisors who sell IUL
-Advisors who are thinking of selling IUL
-Those who want to sell against “bad” IUL products
I can’t imagine why ALL advisors wouldn’t want to know the 25-year historical rolling average rate of return an IUL policy would have returned based on different cap rates.
Also, I hate to say this, but I forgot to send out the year-end numbers for 2024. So, the last time I updated this in a newsletter, it had 2023 year-end numbers. When you sign up for the 2025 year-end numbers, you will also get the 2024 numbers (and you can compare 2023, 2024, and 2025 numbers).
I first issued this report in 2021. Since then, the S&P 500 has had the following returns:
-19.44% in 2022
+24.23% in 2023
+23.30% in 2024
+16.41% in 2025
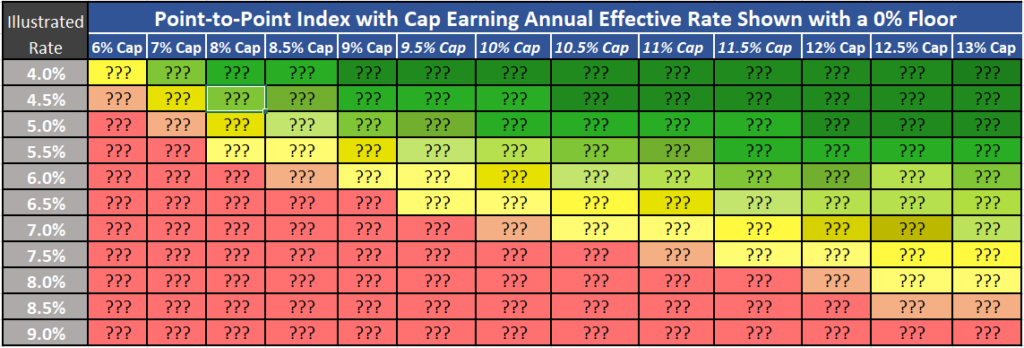
What are Realistic Illustrated Rates of Return?
This is the #1 question clients ask when evaluating an IUL as a wealth-building tool. Most advisors don’t know how to answer this vital question. I’ll give you a hint: it’s not nearly as high as what IUL carriers allow you to illustrate.
If an IUL has a 12%, 11%, 10%, 9%, or 8% S&P 500 annual point-to-point cap, what is the probability that the product would have generated a return of 5%-6.5+% over the last 25 years?
10% Annual Pt-to-Pt S&P 500 Cap
The average cap rate (S&P 500) on most products is 10%. Some are a little higher, and some are a little lower.
Here are the 25-year rolling average returns for a 10% cap:
19.2% chance of generating a 6% rate of return
61.5% chance of generating a 5.5% rate of return
Think about the products you’ve sold in the past and the rate of return you illustrated!
Expectation setting and lawsuit avoidance
The reason advisors should use this probability of return chart with clients is to set expectations properly. When you over promise and under deliver, you get upset clients(some who will look to file lawsuits and there are many in the industry now over bogus illustrations).
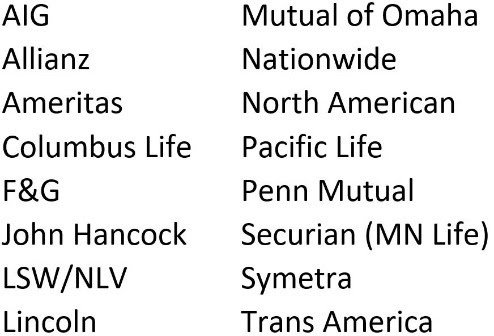
Actual IUL Historical Renewal Cap Rates
The probability of return chart generates numbers using various pt-to-pt cap rates.
When you run an “in-force” illustration showing the client how their policy is doing and what the projected “tax-free borrowing” might look like, you MUST use the current caps, NOT the caps at issue. This is a HUGE problem when using a carrier that DUMPS caps!
To download the renewal cap history of the top 18 IUL carriers, to see which ones have a documented history of DUMPING caps, click on the following link:
https://advisorshare.com/iul-renewal-cap-rates

The CRCS™ is Launching on January 19th
Click here to sign up for information on the industry’s ONLY Roth IRA conversion certification.