

To watch a recorded webinar by Joe Maas, CFA, CFP®, ChFC, CLU®, MSFS, CVA, ABAR, CM&AA, CCIM, where he explains how he runs Tactical Focused Equity, click on the following:
https://advisorsharewm.com/focused-growth
FYI, ANY advisor can get access to Joe’s strategy to use with clients on our “anti-tamp” platform!
Year-to-Date Returns
It’s cool that Joe’s strategy is up 29% year-to-date vs. 21% for the S&P 500.
What’s even cooler is that Joe’s strategy has been holding 15%-20% cash in 2024. That means if the market had a large drawdown this year, Focused Tactical Equity would have had a lower drawdown than the S&P 500.
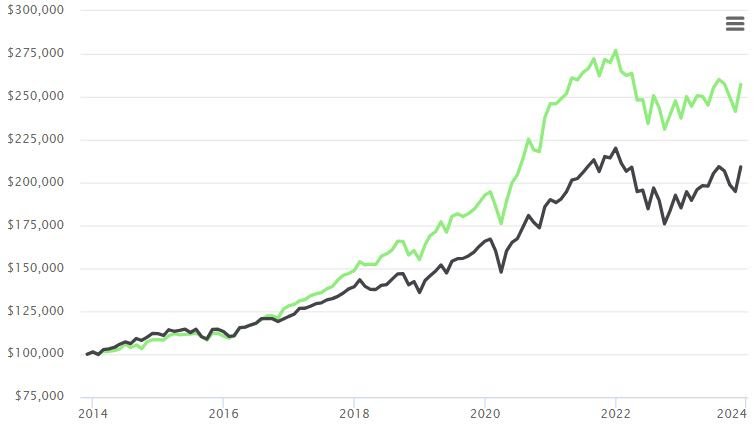
12 Years of Actual Returns
Tactical Focused Equity is a strategy Joe has been running for 12 years.
12-year comparison with the S&P 500
| Tactical Focused Equity | = 17.97% (CAGR) |
| S&P 500 | = 15.56% (CAGR) |
If you started with $100,000, the S&P 500 would have grown to $572k; Tactical Focused Equity would have grown to $834k. Which line would a client like better? Green or Black? Green of course.
Howard Capital’s Tactical Growth Fund (HCMGX)
As you read the following, keep in mind that the expense ratio for HCMGX = 2.02% (which is crazy for a strategy that has lower returns and higher drawdowns than the S&P 500).
Howard Capital is an often-used 3rd party “tactical” manager. I’ve been watching Howard Capital for 10+ years and while their marketing is terrific with their “HCM-BuyLine®,” in my opinion, the “risk- adjusted returns” have not lived up to their billing.
Let’s compare Howard Capital’s HCMGX fund to Joe’s Tactical Focused Equity:
2024 CAGR year-to-date (end of October using monthly returns)
| -Howard Capital’s HCMGX fund | = 22.97% |
| -S&P 500 | = 20.78% |
| -Joe’s Tactical Focused Equity | = 28.91% |
Now let’s compare July 2014 to October 2024 CAGR (Howard’s fund started in July 2014)
| -Howard Capital’s HCMGX fund | = 12.64% |
| -S&P 500 | = 13.10% |
| -Joe’s Tactical Focused Equity | = 15.10% |
What about Maximum Drawdown? Many advisors who used Howard Capital in 2022 found out that this tactical manager who was supposed to be managing risk didn’t do a good job.
Max drawdown going back to July 2014
| -Howard Capital’s HCMGX fund | = 38.56% |
| -S&P 500 | = 23.92% |
| -Joe’s Tactical Focused Equity | = 22.28% |
If you are using Howard’s HCMGX fund, what’s the sales pitch? That you use a strategy that has larger drawdowns than the S&P 500 with lower returns (and higher fees)?
I’ve talked with many upset advisors who bought into the risk/return strategy of Howard and then got burned in 202.
Look at the following drawdown chart since July 2014. Howard Capital’s HCMGX fund (blue line) has three distinct drawdowns. Joe’s Tactical Focused Equity (green line) has the least drawdown with the best returns (the black line is the S&P 500).
What are you doing to differentiate yourself from your competition?
What are you doing to differentiate yourself from your competition? Using a strategy like Joe’s Tactical Focused Equity can help you illustrate why what you are offering to clients is better/different than your competition (especially if those competitors are using firms like Howard Capital or other under-performing 3rd party managers).

Finally, the charts used in this newsletter are from OnPointe Risk Analyzer (the industry’s best point of sale tool). To learn more about OnPointe, go to www.onpointesoftware.com.